You are here
Localized deformation of tensioned NiTi wire analyzed by 3D-XRD method
Martensite Band Front in tensioned NiTi wire analysed by 3D-XRD method
|
|
Figure 1: Elastic strain and stress tensors in ~15000 oriented austenite grains were determined by the analysis of the 3D-XRD data using elastic constants of the austenite phase. The animation shows maximum shear stresses in grains. The complete 3D-XRD dataset contains information on the grain size, grain position, crystal lattice orientation, strain tensor and stress tensor in ~15000 austenite grains within the scanned 0.2 mm long segment of the 0.1 mm thin NiTi wire.
|
|
|
Grain elastic strain/stress visualization tool Select the elastic strain or stress component or the stress glyph to be shown in the continuously running animation below. Use the slider to denote the z-position within the wire where you want to look at. |
||
|
|
|
empty
CS: 0
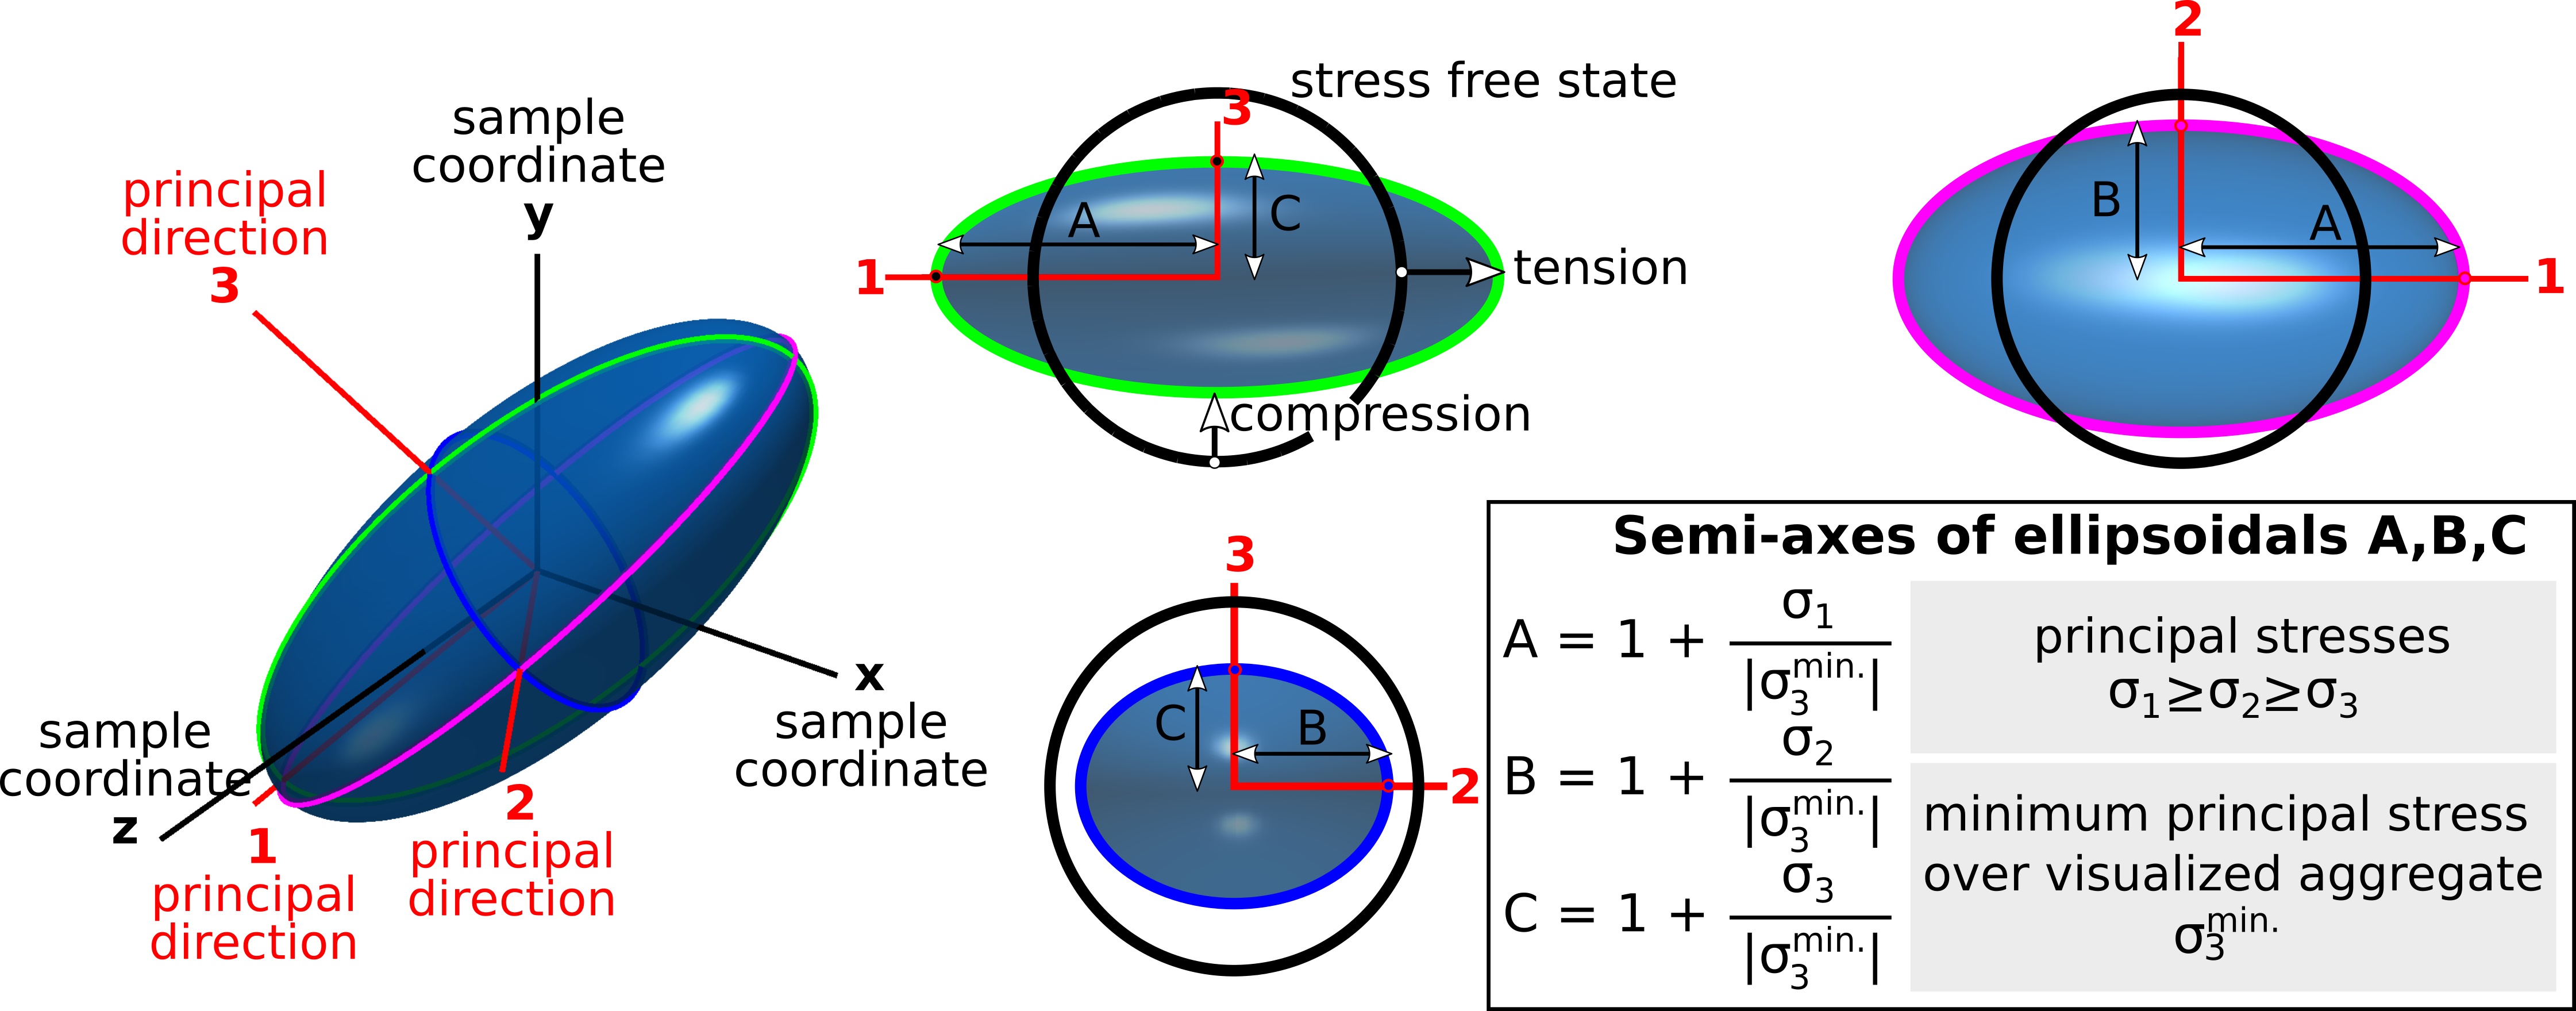
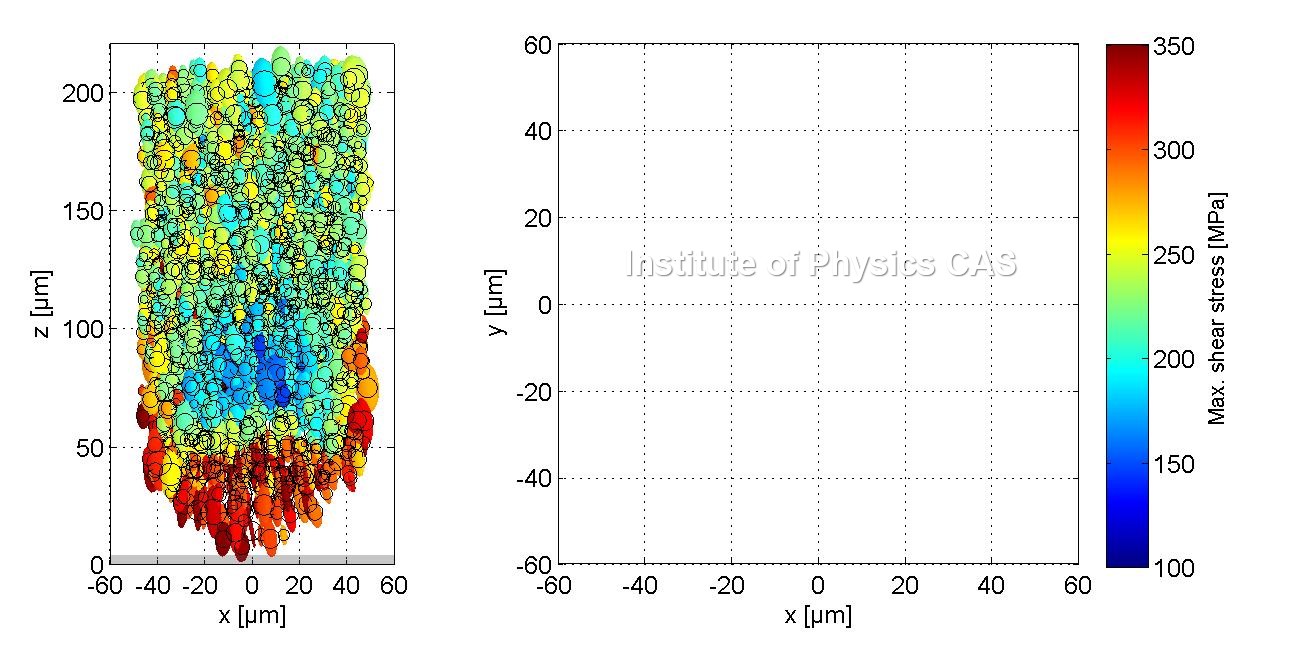
Figure 2: Visualisation tool allowing for inspection of individual components of the strain and stress tensors in austenite grains ahead of the propagating Martensite Band Front in tensioned NiTi wire. Stress and strain states in grains within the 10 µm thick vertical layer and in four 4 µm thick horizontal layers are shown.
- In case a stress and elastic strain component is selected, sizes of the spheres scale with the grain size and color shows the component value.
- In case the stress glyph is selected, ellipses visualize stress tensors in grains as 2D projections of ellipsoids with semi-axes A,B,C in principal stress directions. Imagine the principal stress deforming a unit sphere into ellipsoid. The shape and inclination of an ellipse in the figure thus denote stress state in a grain, color denotes the maximum shear stresses and the black circle denotes the size of a grain located at given position.
It is not just that the 3D-XRD method allows for determination of stress tensor in constrained polycrystal grains as small as 1 µm, but it is important that the orientation of the crystal lattice within each grain is known (Fig. 3).

Figure 3: Maximum shear stress in oriented grains within 10 µm vertical and 4 µm horizontal layers. Grain orientation and size is suggested by the orientation and size of the polyhedron, color denotes the shear stress.
Knowing the stress state with respect to lattice orientation in each grain, it is possible to asses the critical resolved shear stress for the onset of inealstic deformation mechanism in each grain, in present case the stress induced martensitic transformation (Fig. 4),

Figure 4: Maximum resolved shear stress for stress induced martensitic transformation into martensite habit plane variants in grains within 10 µm vertical and 4 µm horizontal layers.
Take away
Stress and strain tensors in ~15000 austenite grains within the Martensite Band Front in tensioned NiTi wire were determined by the 3D-XRD method with exceptionally high resolution in position (~1 µm), strain (~1 × 10⁻⁴), and stress (~20 MPa).
There is mesoscopic heterogeneity of grain resolved local stresses which can be correlated neither with the grain size nor with the grain orientation with respect to the load axis.
There is macroscopic stress heterogeneity within the propagating nartensite band front characterized by elevated shear stress in grains at the buried cone shaped interface.
Quick Links
Copyright © 2015 OFM AV ČR, v. v. i.