You are here
Scale transition to macroscopic internal stress in tensioned NiTi wire
Scale transition from local stresses in grains to macroscopic stress field in tensioned wire
Figure 1: Grain resolved local stresses in austenite phase (maximum shear stress) evaluated by the analysis of the by 3D-XRD.
In order to determine macroscopic continuum internal stress field comparable with simulation results by FE implemented SMA model, we performed scale transition from the pixelated grain resolved stresses determined in 3D-XRD experiment (Fig. 1) towards macroscopic continuum stresses through averaging individual stress components over spherical volumes of different size (Fig. 2). The spherical volume was moved around within the dataset and the scatter between the averages was evaluated.
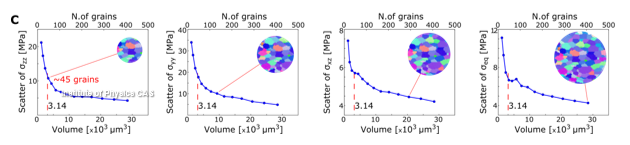
Figure 2: Statistical scatter in the value of the mean axial stress depending on the size and position of the spherical constitutive volume over which stress components are averaged moved around the wire microstructure far from the martensite band front (z=100-200 in figure 1).
It appears, that for a given microstructure (grain size, texture), there is a minimum number of grains (minimum volume) for which a statistically meaningful macroscopic continuum stress state is obtained.
Internal stress field within the martensite band front
Taking into account the minimum number of grains necessary to derive statistically meaningful macroscopic stress state in a representative volume, scale transition to macroscopic stress was performed as suggested in figure 3.
![]()
Figure 3: Scale transition from the pixelated stress field towards the macroscopic continuum internal stress field. Exploiting the radial symmetry, the volume of the wire in cylindrical coordinates (Fig. 3) was divided into “equivolumetric cells” (4 μm in vertical z direction and concentric equal area annuli in xy plane with radii 50, 47.435, 44.72, 41.84, 38.734, 35.361, 31.63, 27.39, 22.37, 15.83; cell volume = 3144 mm3; ~45 grains). This is the minimum cell volume below which the scatter starts to rise sharply. The grain resolved stress components weighted by the grain size were averaged over these cells, associated with the center of mass position of the cells (r,z coordinates) and interpolated between cells to obtain the macroscopic internal stress field in the wire (Fig. 4).
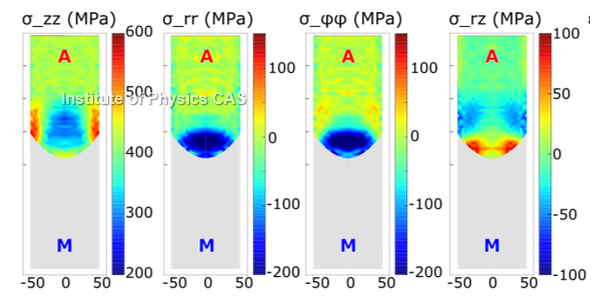
Figure 4: Macroscopic internal stress in austenite phase within the martensite band front in tensioned NiTi wire.
Two mutually different stress tensors were evaluated in each material point: one characterizing pixelated local stresses varying in a stepwise manner from grain to grain, which control the progress of martensitic transformation on the lattice level, the other one corresponding to macroscopic continuum stress field varying continuously across the wire which can be confronted with the results of mechanics modelling. Both stress fields are approximations of the real internal stress field in the wire showing gradients within grains.
Take away
The 3D-XRD method with proper scale transition represents a 3D-XRD stress tomography method enabling for evaluation of internal strain and stress tensor fields in bulk polycrystalline engineering materials with exceptionally high resolution in position (~1 µm), strain (~1 × 10⁻⁴), and stress (~20 MPa).
Quick Links
Copyright © 2015 OFM AV ČR, v. v. i.